February 18, 2025
Simplifying Latency Visualisation for Clarity Over Complexity
mosaicOA,
Get notified of the latest news, insights, and upcoming industry events.
Streamlining Latency Visualisation for Faster Decisions

Minimising latency is essential for maintaining a competitive edge in the capital markets. Traditional latency visualisations, like line graphs, can be overwhelming and make it difficult for engineers to extract actionable insights quickly from vast datasets. In collaboration with senior market data engineers, CJC’s mosaic team addressed this challenge by introducing a scatter plot approach, following positive and unanimous external feedback. Focusing on latency enabled CJC's engineers to identify performance issues and optimise systems more easily. This approach enhances the ability to pinpoint outliers and inefficiencies swiftly, driving faster and more informed decision-making. This article covers:
Download PDF with citations
 In the capital markets, latency can be the difference between success and failure. Fast and efficient access to market data with minimal delays is crucial, especially when trading decisions are made in fractions of a second. To stay competitive, firms invest heavily to minimise latency and avoid technologies that could slow down their systems. Understanding and managing latency is not just a technical challenge – it’s a business priority for market data systems.
Engineers across the industry have access to tools for capturing and visualising latency. At CJC, we use the award-winning Mosaic platform with multiple in-house tools to capture data at the lowest levels. Recently, our senior engineers collaborated with the mosaic team to benchmark a high-performance market data platform on next-generation cloud equipment. The test’s report needed clear, engaging visualisations to communicate latency data effectively to a broad audience. It was an excellent opportunity for our Mosaic team to understand how senior market data engineers view latency.
The Challenge: Too Much Information
Effective visualisations are a balance of art and science. Mosaic captures large granular datasets, often with more data points than a typical monitor’s pixel count. Making these datasets visually understandable requires careful design. The data is usually time-correlated, so latency is traditionally shown using line graphs, a versatile tool for illustrating trends, spikes, and fluctuations.
 Steve Moreton, Mosaic’s Product Lead, explained “The line graph is a great go-to visualisation. It’s incredibly versatile, from showing CPU performance to networking speeds and update rates. But it can also lead to ‘TMI’ (too much information). You can see highs and lows over time. Still, it can be overwhelming.” Traditional line graphs, while informative, often overwhelm engineers, leaving actionable insights hidden beneath multiple layers of data. As one engineer noted, it can “tell too much of a story.”
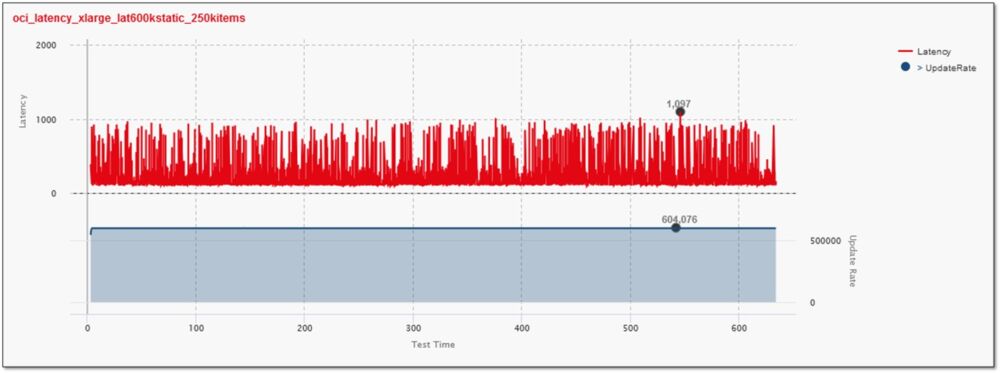
Figure 1: Latency Behaviour Plotted Over Time
Engineer Enhanced View: Focused Scatter Plots
While testing LSEG’s RTC on Oracle’s Cloud, the engineering team felt that traditional line graphs were not effectively communicating the latency data. Sam Grayston, Engineer at CJC, suggested an alternative visualisation using scatter plots and demonstrated the alternative format to the Mosaic team with a snippet of the data, explaining how it clarified latency without relying on time as a factor.
Steve Moreton notes “Sam is one of CJC’s top engineers, and when he showed me his preference, I could see exactly where the latency was over time, without time being a factor in the visualisation”. Sharing the alternative visualisation with the cloud providers and market data vendors at Oracle and LSEG, we received a positive reaction unanimously.
Based on this feedback, CJC adopted Sam’s scatter plot approach, directly correlating latency with update rates. This new format highlighted areas of high and outliers, allowing engineers to identify system behaviour and performance issues swiftly.
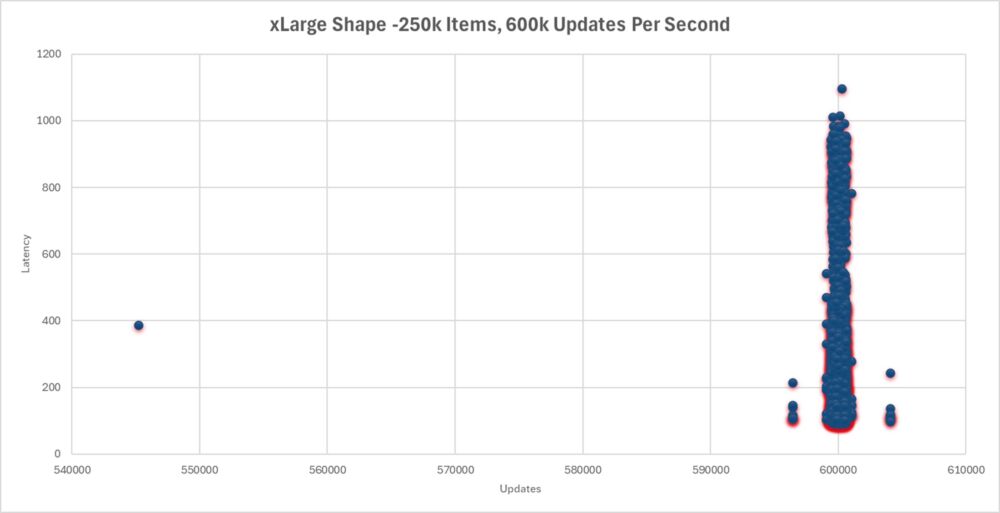
Figure 2: Same Latency Data Plotted Against Updates Per Second, Highlighting Density and Outliers
Engineer Enhanced View: Focused Scatter Plots
- Quick Issue Identification: Clusters of latency show consistent performance, while outliers stand out for troubleshooting.
- Performance Insights: Engineers can easily see where latency is concentrated, supporting system reliability assessment under normal workloads.
- Efficiency Gains: With data ‘noise’ to sift through, engineers can focus on specific areas of concern, saving time and effort for other value-add tasks.
Visualisation Innovation
Recognising the value of Sam’s approach, CJC has integrated the scatter plot chart into Mosaic’s product suite. Engineers can now quickly identify performance hotspots, making it easier to optimise their systems for efficiency and reliability.
This scatter plot method is not tied to any specific platform and can be applied to all real-time market data systems, including RTDS/RTC, Solace, Kafka, and others. By emphasising latency performance in this way, firms gain actionable insights to stay ahead in the competitive capital markets landscape.
About CJC:
CJC is the leading market data technology consultancy and service provider for global financial markets. CJC provides multi-award-winning consultancy, managed services, cloud solutions, observability, and professional commercial management services for mission-critical market data systems. CJC is vendor-neutral and ISO 27001 certified, enabling our partners the freedom to focus on their core business.
For more information, contact us or:
Email: marketing@cjcit.com
Tel: +44(0) 203 328 7600
Get In Touch
Get in touch with our experts to learn how we can help you optimise
your market data ecosystem!
Arrange a Meeting