November 2, 2020
Market Volatility – The Days, Weeks And Months Ahead
IT Analytics,
Get notified of the latest news, insights, and upcoming industry events.

2020 has seen significant market volatility, which is still very much in flight.
Steve Moreton, Global Head of Product Management, CJC
Just over 20 years ago, I first joined the capital markets community working for Reuters. The notorious 2000 US Presidential Election was my first experience of how global events create significant market volatility. It took over a month before George W. Bush was finally (and controversially) decided. It took weeks to stabilise. The 2020 US Election is widely regarded to eclipse this!
CJC, operating in 22 geographical locations and supporting over 800 firms, have a unique viewpoint of how different systems (Refinitiv Enterprise Platform *TREP*, Bloomberg, Exegy, Activ, Solace, Kafka and Tibco) behave and we continually review and run analytics to ensure systems operate in a robust and resilient manner. 2020 has already seen a significant period of volatility from Covid-19, which is still very much in flight. With access to significant traditional and non-traditional data sources and vast power from modern technology, traders have built models and strategies around possible scenarios over the next weeks and months. Many client sources have informed me that they will see 8x times volatility! Keeping a close eye on these systems has shown some significant volume and volatility.
Using our IT analytics tool, mosaicOA, I have compared the behaviour between the last two months of Fridays. Friday normally provides the weeks most significant spikes and activity. I have noticed that while we have seen larger spikes in the past, the volume and volatility has been spread over a longer period.
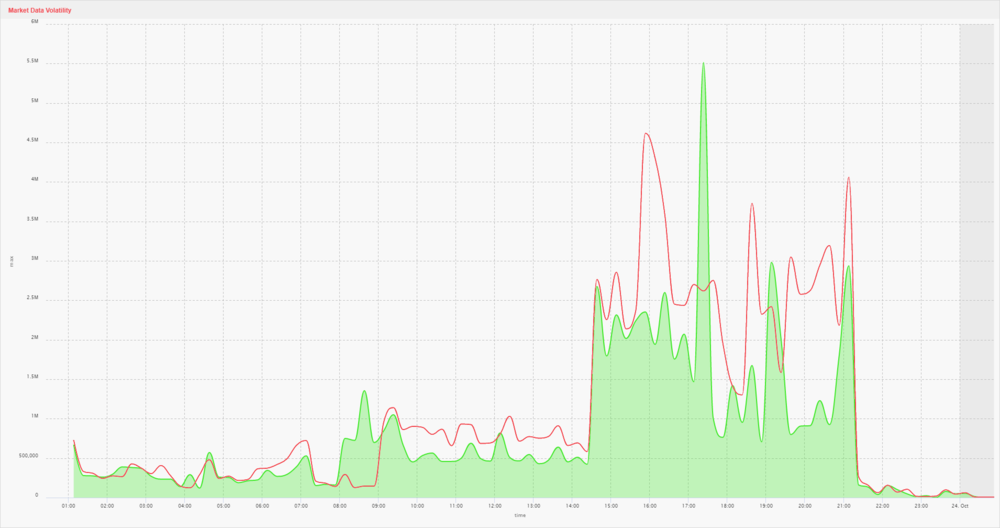
The Green Area shows 10.23.2020. The Red Line shows 10.31.2020. You can clearly see that although on the 23rd, we had a larger spike, the 31st had consistently larger volume throughout the day.
Our systems also tell us that this volume on a weekly basis has been increasing and continues to, as recently as the 10.31.2020 (last Friday).
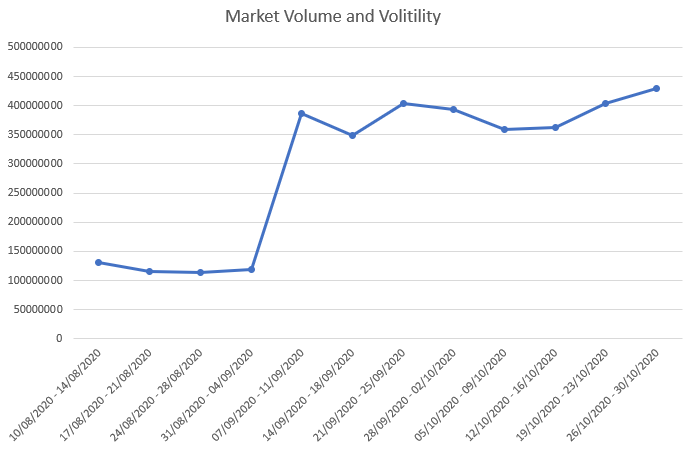
Seven weeks ago, we saw many firms and systems have an increase of 227% in standard behaviour, with the Covid-19 diagnosis of President Trump which ‘lit the touch paper’ and things have not yet returned to normal.
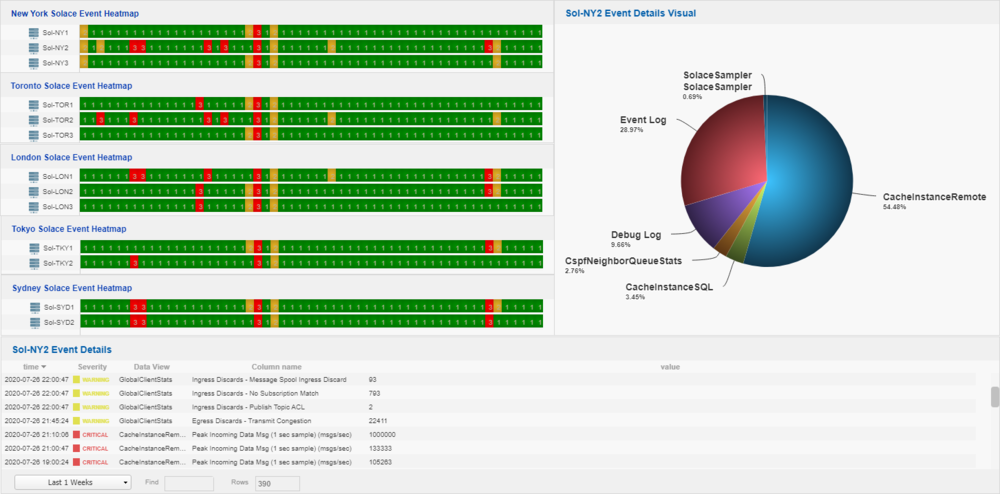
Importantly, over the last 2-3 weeks, we have continued to see an increase, with last week being a notable high. It will be interesting to see how this week developments continue to affect volatility and system behaviour. During this time, CJC have been reviewing our client event heatmaps to ensure that despite volatility, no event is overlooked, and all systems are performing optimally. We reviewed how the system was behaving seven weeks ago, versus how the system is today. The tool makes light work of reviewing hundreds of thousands of events, with subtle yet building event trends quickly standing out.
CJC provide reporting and escalation to our client IT Executives if we need to make changes to configuration or allocate new resource/upgrades to these infrastructures, if we believe they are in danger of creating an issue over the coming weeks.
CJC will continue to provide a world-class managed service to our global client base and ensure that their systems are meticulously analysed and supported. We will also continue to provide regular updates of any other trends we are detecting to our community.
Steve Moreton
Get In Touch
Get in touch with our experts to learn how we can help you optimise
your market data ecosystem!
Arrange a Meeting