February 25, 2021
Case Study: mosaicOA – Critical Issue Identification
Get notified of the latest news, insights, and upcoming industry events.
Critical Issue Identification
In the capital markets, firms can have hundreds of critical IT servers and appliances, distributing real-time data globally. These servers are monitored 24x7, creating thousands of IT metrics and events. When an unprecedented issue occurs, there is a raft of information to decipher.
Background and Context
Recently one of our clients, a global tier 1 bank using mosaicOA - our IT analytics platform - to analyse their entire capital markets estate, had a notable data centre outage. Despite effective resiliency – end users did not lose service – it was still of paramount importance to isolate the specific issue and ensure any and all rectification measures were put in place.
The issue amounted to a suspected network outage between two London data centres housing the Refinitiv RTDS (formerly TREP) platform and specific services impacted included the client’s internally generated EMEA market data feed. Although the event occurred outside EMEA market hours, US users connected to this internal feed and were therefore impacted.
A major, unprecedented event will have immediate priority in rectification processes. In this instance, resiliency placed on the platform ensured that no users were disconnected or had any interruption to service – however, the system was now vulnerable, with an increased risk of system impact to end users. Initial checks of the monitoring platform demonstrated that servers which provided the service, residing in two separate data centres, were online. However, they were not connected to each other. This suggested a network outage – a unique issue since other parts of the network were connected and resilient. Engineers had to undertake a comprehensive review as part of their escalation procedures.
Issue Identification and Investigation
Replay Day's Events
In the first instance, mosaicOA was used to replay the sequence of London events in the hours running up to the specific event under review. Events are created by the monitoring system and captured in a powerful, time-series database, InfluxDB, with an accurate timestamp. Since it is a global platform, mosaicOA recorded 23,800 events on the day of the outage. However, engineers could filter down to the specific region and focus on ‘error and warning’ events. This Immediately brought the numbers down to 187 errors and 218 warnings.
mosaicOA records two forms of data from IT monitoring systems:
- IT Metrics – all updates on the server, e.g. a CPU changing from 44% to 50% utilisation.
- Events – any changes that trigger an alarm, e.g. a CPU hitting a set threshold like 80%.
Event analysis is a good place to start an investigation. Error messages and warnings are recorded and can be reviewed.
By clicking on EMEA (fig 1), corresponding event windows, both visual (fig 2) and text updates (fig 5), will automatically update to display that specific region, server or event. For example, in the screenshot below, all EMEA events for a 1-day period are displayed. The engineer can see the day’s behaviour. The engineer can also click on the events or the right-hand Error Type legend for further detail.
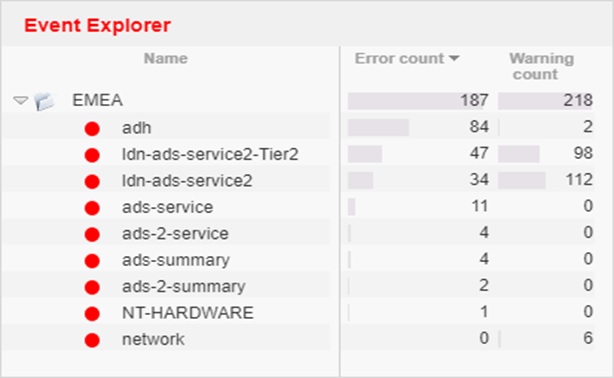 Figure 1. The Event Explorer - focuses on the seconds or hours leading up to the event |
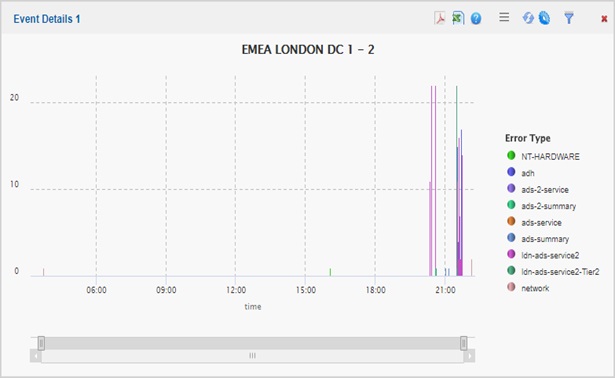 Figure 2. The Event Explorer - the events are also shown visually |
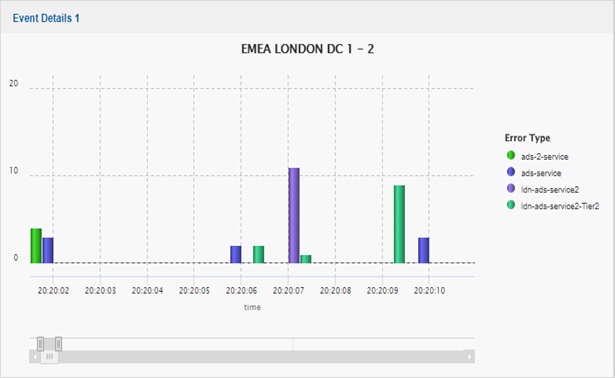
Figure 3. The Event Explorer - the events zoomed into
The visual can be zoomed into, so specific time periods can be looked at graphically, against an accurate timestamp.
As events are zoomed into, the legend automatically updates to display only those in the time frame displayed. For this specific incident, the zoom filtered out redundant error types and focused investigation onto the ADS layer – on a Refinitiv RTDS, these are the servers which distribute market data to the end users. On deeper inspection, figure 4 shows that it was the ADS-2 servers that started to error first – this was a significant identifier of data centre location and network layer. Error messages are grouped together and shown against a timestamp; the originator events and the secondary messages which follow the original issue can be seen. For example, ADH errors do not occur at all until 1 hour after the service impact. The ADH service, which adds reliability to market data, was effectively ruled out at this stage.
For further clarity, events require actual text data. As well as graphical data, mosaicOA also provides correlated detail in a separate window. As engineers navigate graphically through the error messages, these messages are also shown in detail, greatly speeding up the process of review and resolution planning.
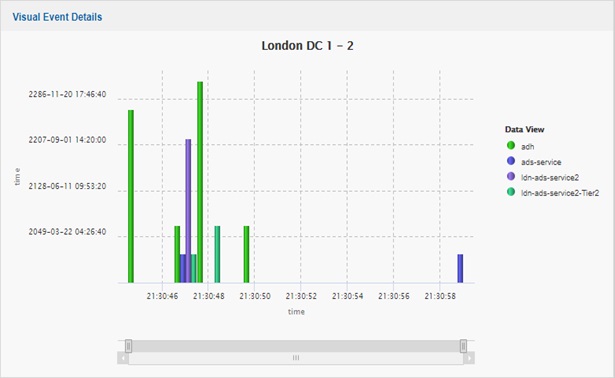
Figure 4. The Event Explorer - ruling out ADH events
Our client could quickly review and replay the events. They could see that the events were initiated in a specific data centre, on the client-facing (south side) aspect of the service. There were no issues detected at the ADH (north side). This provided an analysis which focused engineers on an escalation path with the firm’s network team. Further detail however was required from the IT metrics. Users wanted to replay what the servers were doing specifically in the run-up to the event for the following reasons:
- Confirm there was no unusual activity on the system which could have triggered the event.
- Provide any further detail to relevant network teams.
- Provide a rationale for new monitoring techniques or thresholds.
The support team could see that the only part of the system affected was the ADS layer from an event perspective. As detailed above, not only the recorded events but the IT metrics themselves can also be reviewed and replayed. Users can review every single change on the RTDS, as it’s all recorded in the time series database.
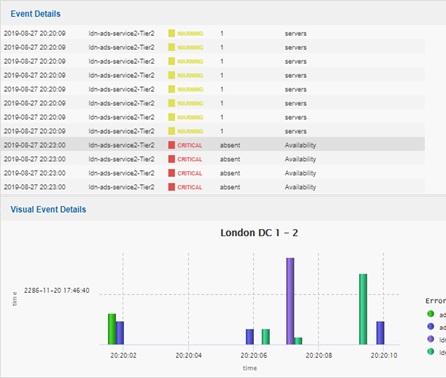
Figure 5. Events shown as text and visuals combined
Unusual Activity
To demonstrate unusual activity, mosaicOA provides a visualisation of system behaviour, which can be simultaneously seen against historical peaks and standard behaviour. In the event analysis page (and in dedicated dashboards), the servers which are demonstrating errors can be selected and then seen in the system behaviour window:
Figure 6 displays a view specifically designed by an end user from our tier 1 bank client and shows three sets of visual information in one window. The dark blue ‘value’ line shows what’s happening now. The dotted black line ‘means’ shows the standard and normal behaviour. The light blue ‘min/max’ line shows historical peaks and troughs. By clicking on the server with a known event, it is clear that from 15:00 (US market open) the system’s behaviour – CPU, Memory, DeviceIO, Network and application statistics collated via Principle Component Analysis – increases. However, at no point did the system go beyond 20% system resources at the time of the incident, or at any time over a defined period – in this case, 30 days.
Users may wish to look at each server’s IT metrics and events simultaneously. Although not one of the core event analysis dashboards, this is an existing dashboard on mosaicOA. The server can be selected (top right) and all events and IT metrics viewed across a designated time period are automatically shown. These visualizations have been designed by leading capital markets IT architects and engineers.
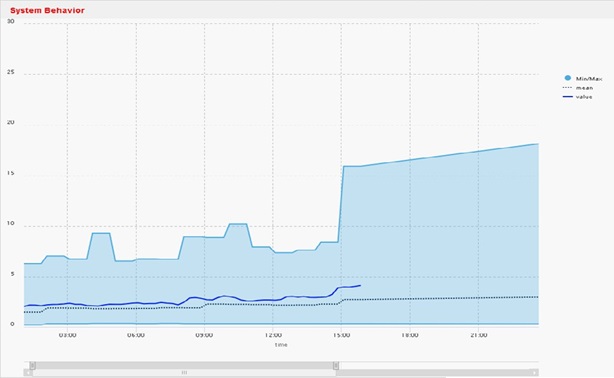 Figure 6. System Behaviour - showing the server's normal and peak activity in one view |
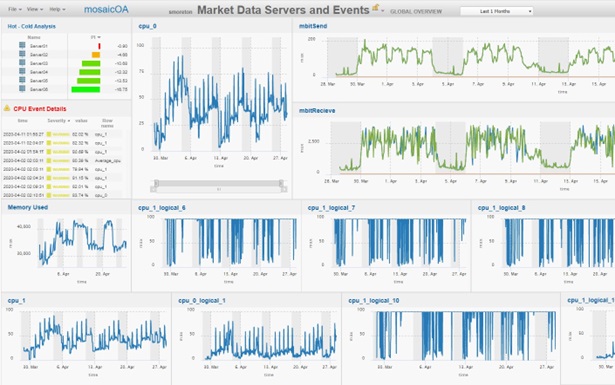 Figure 7. Each server has full visuals and events combined |
Further Event Detail
To provide further detail for escalation, the client wished to replay specific IT metrics - an IT metric is different to an IT event. A CPU can create 15 million IT metrics every day – but could only create a few events a week – which is when the IT metrics go above a set threshold (for example 80%). This will trigger a rule to create an event.
Specifically, the client was looking for when resilient servers went from two down to one – and back to two again.
This was a key indicator of the mean time to resolution (MTTR). In mosaicOA, this was a simple matter of seeing all the updates to that IT metric over a specific time period.
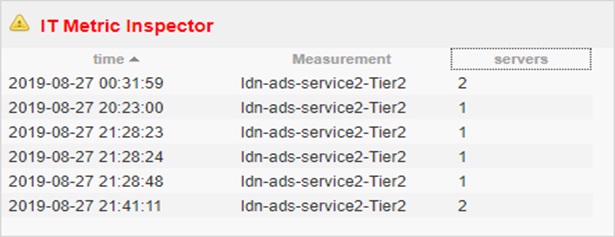
Figure 8. IT Metric Replay - showing any changes to the system which did not generate an event
Results Summary
Through mosaicOA, the client was able to see all the events and IT metrics associated with an event. Their team was able to rapidly review thousands of events in minutes, creating a comprehensive escalation report to third-party network teams. They would also know that the report and data were stored indefinitely, should there be a need to review for future fault testing, or in the worse case, a repeat of the issue.
Importantly for the client, the engineers were able to prove beyond any doubt the monitoring, alerting and support in their remit was to a gold standard, via the IT analytics of mosaicOA.
About CJC:
CJC is the leading market data technology consultancy and service provider for global financial markets. CJC provides multi-award-winning consultancy, managed services, cloud solutions, observability, and professional commercial management services for mission-critical market data systems. CJC is ISO 27001 certified, enabling CJC’s partners the freedom to focus on their core business.
Get In Touch
Get in touch with our experts to learn how we can help you optimise
your market data ecosystem!
Arrange a Meeting