October 8, 2020
Spreadsheets – The Killer App In More Ways Than One
IT Analytics,
Get notified of the latest news, insights, and upcoming industry events.

Spreadsheets provide a vital function… a function that can easily lead to issues.
Steve Moreton, Global Head of Product Management, CJC
This week reported the news that the UK Government has been embarrassed by its key monitoring agency under-reporting COVID-19 infections thanks to a misconfigured Excel spreadsheet. Keeping things purely technical and not political, this was not a surprise.
Spreadsheets are a must-have application and can easily become an integral engine of almost any industry. I have witnessed this practice countless times in the capital markets. On multiple trade floors, I have seen vast Excel spreadsheets, both in physical size and complexity, exist as the ‘secret sauce’ of strategy and pricing. Examples go from the financial services industry, to manufacturing, government, sports and even space agencies where spreadsheets provide a vital function… a function that can easily lead to issues.
However, it’s easy to see the popularity. Spreadsheets are fantastically powerful applications, providing virtually everyone immediate power over their data. We have all applauded ourselves with the stunning use of a function, complex formula or a great pivot table. Indeed, going back to my 1995 college notes:
“Going back to Lotus 1-2-3, spreadsheets are the original killer app. Spreadsheets are what made the Personal Computer an indispensable tool for the business and home. If you’re going to buy one application, buy a spreadsheet. You can write a letter, do your accounts, make a database – you can even play games and draw pictures.”
This versatility combined with, well, practically everyone being a skilled resource means the spreadsheet is a first port of call to manage data. For a small or medium-sized business, it’s usually faultless but for a larger enterprise, more consideration is required. Spreadsheets are ideal to prove a concept, perhaps as part of the development phase of a product or strategy, but this ‘go-to’ choice of spreadsheets can lead to problems. Continued development can quickly move the spreadsheets capabilities to a realm where it is no longer fit for purpose and superior tooling should have been selected, such as a database or product. I have witnessed huge IT transformation projects delayed by months while critical spreadsheets are updated and tested. I have also witnessed massive trade floor outages due to a simple spreadsheet formula. It’s a killer app in more ways than one.
I frequently encounter spreadsheet-based limitations and issues in IT capacity management. Limitations in Excel for instance, is all about perspective. After all, a million rows of data is nothing to be sniffed at. With that said, a server can easily generate from 1 to 15 million IT metrics every day from CPU, Networking, Hardware, OS and application statistics; that’s just one server. What about when you have 30, 100, or 1000 servers? That’s billions of metrics needing to be stored every day – true Big Data. These statistics are vital for quality capacity management; so how do spreadsheets manage to provide capacity management?
Well, first you must reduce the data; not compression but deletion. To get Excel to provide this function, 99% of the data is deleted and granular, sub-second data is now one update per hour. This reduction of vital data is not at the granularity levels needed for accuracy. After some time, that reduced data is still deleted between one week and two months to make way for the new data created every day. Vital history and market swing events are purged forever.
I have seen some wonderful work in Excel, make no mistake. Engineers have spent a great deal of time making vast, multi-tab Excel files, with highly complex formulas and functions, all making some impressive looking visualizations. With that said, outages happen, and capacity breaches occur. Excel is not a place to build data science or machine learning techniques. This is because Excel is just not fit for purpose and never has been.
Let’s look at this graphic from CJC’s capacity management solution, mosaicOA:
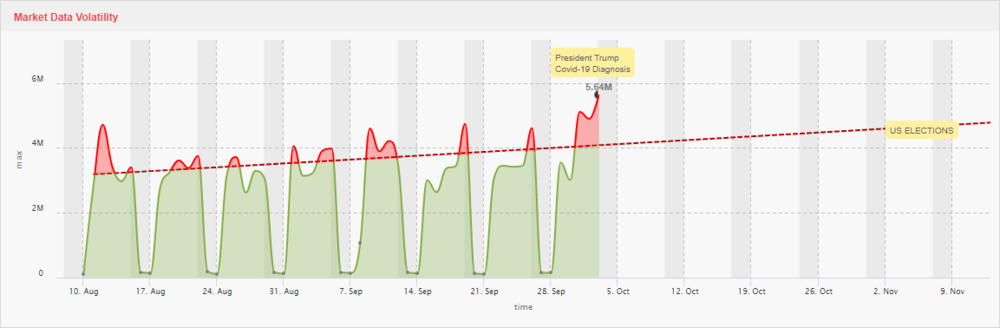
Capacity planning using application generated market volatility statistics to predict upcoming trends
This simple area chart shows market data usage. This shape is derived from multiple global servers and in total, just over 150 million statistics. This data is stored in a powerful, time-series database. All IT metrics are stored indefinitely, and a powerful analytics engine retrieves the data for an accurate, on-screen depiction in real-time. Capacity management requires correlation to other application and server components, even economic calendars and events need to be inputted. Data sorting and machine learning techniques are bolt-on additions to the database. Unquestionably, these capabilities have long left the wheelhouse of the humble, ever-present spreadsheet.
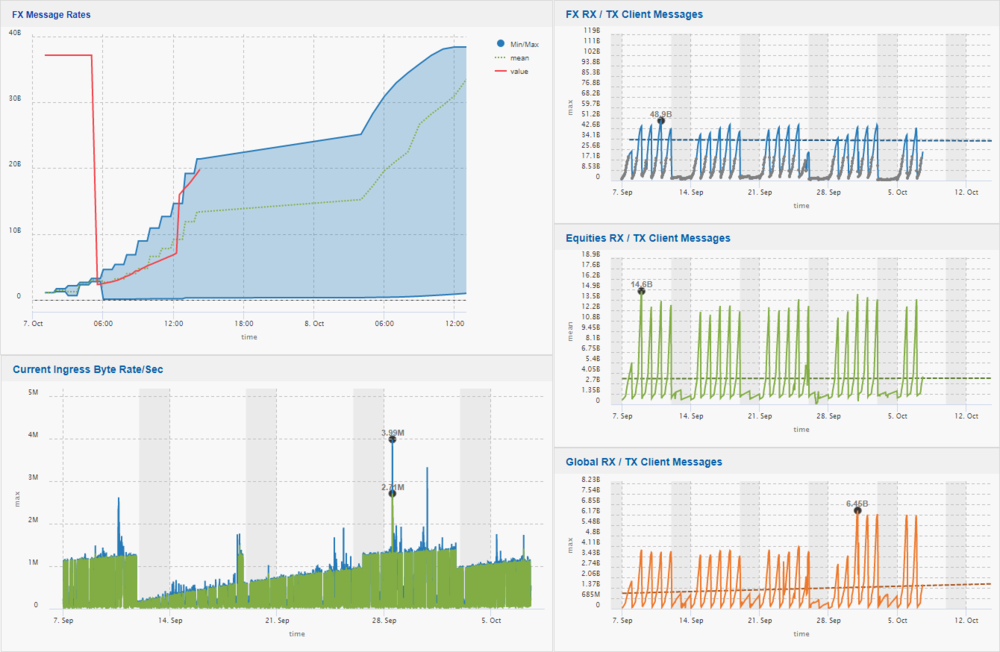 Billions of IT metrics all easily viewable, complete with machine learning and advanced analytics
Market volatility in 2020 is a key concern; many firms have experienced outages during the initial Covid-19 volatility period. With possible secondary lockdowns and the US presidential election approaching, if your IT team is using spreadsheets to provide analytics and reporting, perhaps it’s time to question if they have the right tooling for the job.
Learn more about mosaicOA
Steve Moreton
Get In Touch
Get in touch with our experts to learn how we can help you optimise
your market data ecosystem!
Arrange a Meeting